François Rioult's homepage
Associate Professor in computer science - University of Caen - CNRS UMR6072 GREYC - France
Investigating the DotA Pulse
On our way to DotA’s analysis, we deliver here some preliminary results on the pulse of DotA.
We are only interested in high level DotA, namely here The International 5 (TI5).
We analyzed:
- a corpus of 48 games of the final stage
- we considered the time (in minutes) where each objective (tower, barracks) falls
- strategic semantic were applied:
- for each team, there are three lanes: safe, mid, hard
- and 4 tiers: tier1, tier2, tier3 for the tower on the lanes, tier4 for those protecting the throne.
- independently of the team, an objective was considered regarding the difficulty of its lane. For example, top Radiant tower (hard) is equivallent to Dire’s bottom (and vice-versa)
- an objective was attributed to the \“won\” (resp. \“loss\”) category if it felt because of the winner (resp. loser) of the game
- due to the lack of data, we may have only consider the objectives taken by the winner.
For easy reading, we give below the boxplots of the distribution, tier by tier. They allow to quickly estimate the mean and the dispersion of the values. Further statistical tests should be assessed, but interesting comments appeared.
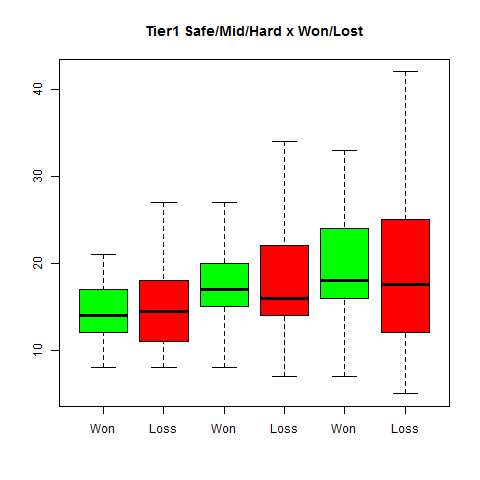
First line of towers (tier1)
The figure below represents the boxplot of the \“time-to-fall\” of the Tier1 towers, in green when they were taken by the winner (red for the loser).
Let’s observe that:
- for the winner, the first tower to be taken is the safe tower of the losers: teams first try to open the space and drastically reduce the control map.
- for the loser, the rhythm can be quicker than the winners’ one. This tendency will be confirmed for the next tier.
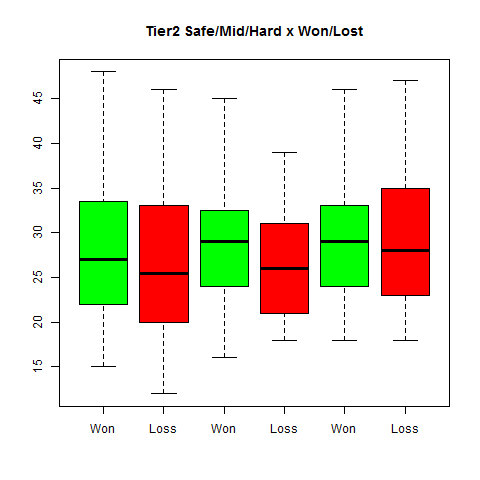
Second line of towers (Tier2)
The previously exhibited tendency is confirmed below:
- safe lane stays the favorite target
- loser teams tend to take the objectives earlier that the winner ones.
Would there exist any reasonable rythm for DotA ? Yes: not too slow, not too fast.
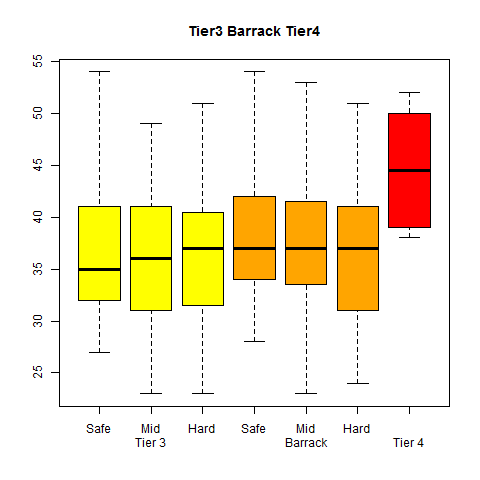
Attack of the base
The below boxplots give only information about the winner team.
Nothing really surprising, just remind the order : safe, mid, hard.
Conclusion
We only delivered here an univariate rough analysis of the times where objectives fall in DotA. It is just a way to our main goal, wich addresses the dynamic of the confrontation. But it already gives more insight about how to grasp the pulse of DotA.
Who are we?
François Rioult, Nicolas Calenge, Mehdi Kaytoue.