François Rioult's homepage
Associate Professor in computer science - University of Caen - CNRS UMR6072 GREYC - France
Below are some details about the online version of Hurmony - Tonality Visualization.
Tonality Visualization
This work aims to provide a dynamic visualization of tonality throughout a musical sequence.
- each score is arranged as a quartet from the original
- then exported in
MusicXMLformat - the
Verovioapplication converts theMusicXMLformat toMEI, another XML version (which can also be obtained through XSLT transformation) - the
Humdrum Extraslibrary converts theMusicXMLformat tohumand performs tonal analysis - I assemble everything into JSON after various processing steps to generate the visualization
Tonality Computation
The harmony data is provided by the mkeyscape utility, which defines an analysis step, here set to the eighth note. For example, on the 26 four-beat measures of the reference Bach BWV555, mkeyscape computes, for 26 * 4 = 104 points, the tonality:
- To compute the tonality,
mkeyscapesubmits the notes expressed at each analysis point to the Krumhansl-Schmuckler algorithm, which establishes a Pearson correlation between the measured pitch class histogram and the predefined profiles for major and minor keys. - At the eighth note granularity, the obtained data is quite chaotic. However, we want a bit of stability, and
mkeyscapeprovides analysis results for all numbers of points less than the requested value:- for 104 points, values vary at every point
- for 103 points, the measurement is much more stable.
- for 1 point, we obtain the global tonality of the piece
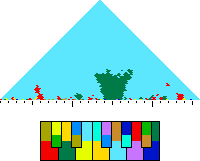
mkeyscape produces enough analyses to represent them in a triangle, where each line represents a different level of analysis granularity.
Visualizing a Tonality
The colors are inspired by my daughter’s synesthesia. Major and relative minor are merged.
For major keys, the root and the fifth are located on the outer circle, and linked to the minor third on the inner circle. For minor keys, it is the opposite.
This visualization technique arranges the keys around a circle in such a way that their geometric proximity reflects harmonic proximity.